

In the previous edition of the technical note, it was mentioned about the persistently low levels of INDIAVIX, the volatility gauge, and how it can leave the markets vulnerable to profit-taking bouts. The week that went by saw the first cracks appearing in the frontline indexes that may have put an intermediate top in place for NIFTY subject to confirmation on the charts. After trading largely in the positive, the index gave up all its gains on the last trading day. The trading range also remained narrow; NIFTY oscillated in the 225.05 points range through the week. While closing near the low point of the week, the benchmark NIFTY index closed absolutely flat with a negligible gain of just 4 points (+0.02%) on a weekly basis.

From a technical perspective, we will now need to look at a few important points. The volatility index, INDIAVIX, spiked by 12.31% to 12.30 on a weekly note, but it still remains very near to one of the lowest levels seen and it still has some room on the upside. Secondly, the high point of NIFTY seen on Thursday, 18267.45, remains the most important and immediate resistance for the Index. Unless this level is taken out, all technical rebounds will find stiff resistance at this point and we will not see any meaningful up move so long as NIFTY is below this point. Thirdly, looking at a very short-term perspective through Options data, the index has dragged its resistance lower between the 18100-18200 zone as shown by the high addition of Call OI in this zone.
Given the steep sell-off that was seen towards the end of the session, Monday may see a modestly positive start as the markets may attempt a technical pullback. In any case, the levels of 18200 and 18325 will act as resistance. Supports come in lower at 17880 and 17600 levels.
The weekly RSI is 56.35; it remains below 60 and stays neutral and does not show any divergence against the price. The weekly MACD is bullish; it trades above its signal line. A candle which is almost a Shooting Star formation has emerged on the weekly charts. They may lead to a potential formation of an intermediate top subject to confirmation on the next bar.
The pattern analysis of the weekly chart shows that the NIFTY might have put a potential intermediate top in place at 18267 (rounded off to 18300). This would mean that unless the index moves past the 18267-18300 zone, it will continue to find stiff resistance near this zone.
All in all, any technical rebounds, if they occur, should not be blindly chased. Instead, it would be prudent to continue staying highly selective while approaching the markets. It would make more sense to focus on stocks from the broader universe that have strong and rising relative strength and have promising individual technical setups. While continuing to protect profits vigilantly at higher levels, a cautious outlook is advised for the day.
Sector Analysis for the coming week
In our look at Relative Rotation Graphs®, we compared various sectors against CNX500 (NIFTY 500 Index), which represents over 95% of the free float market cap of all the stocks listed
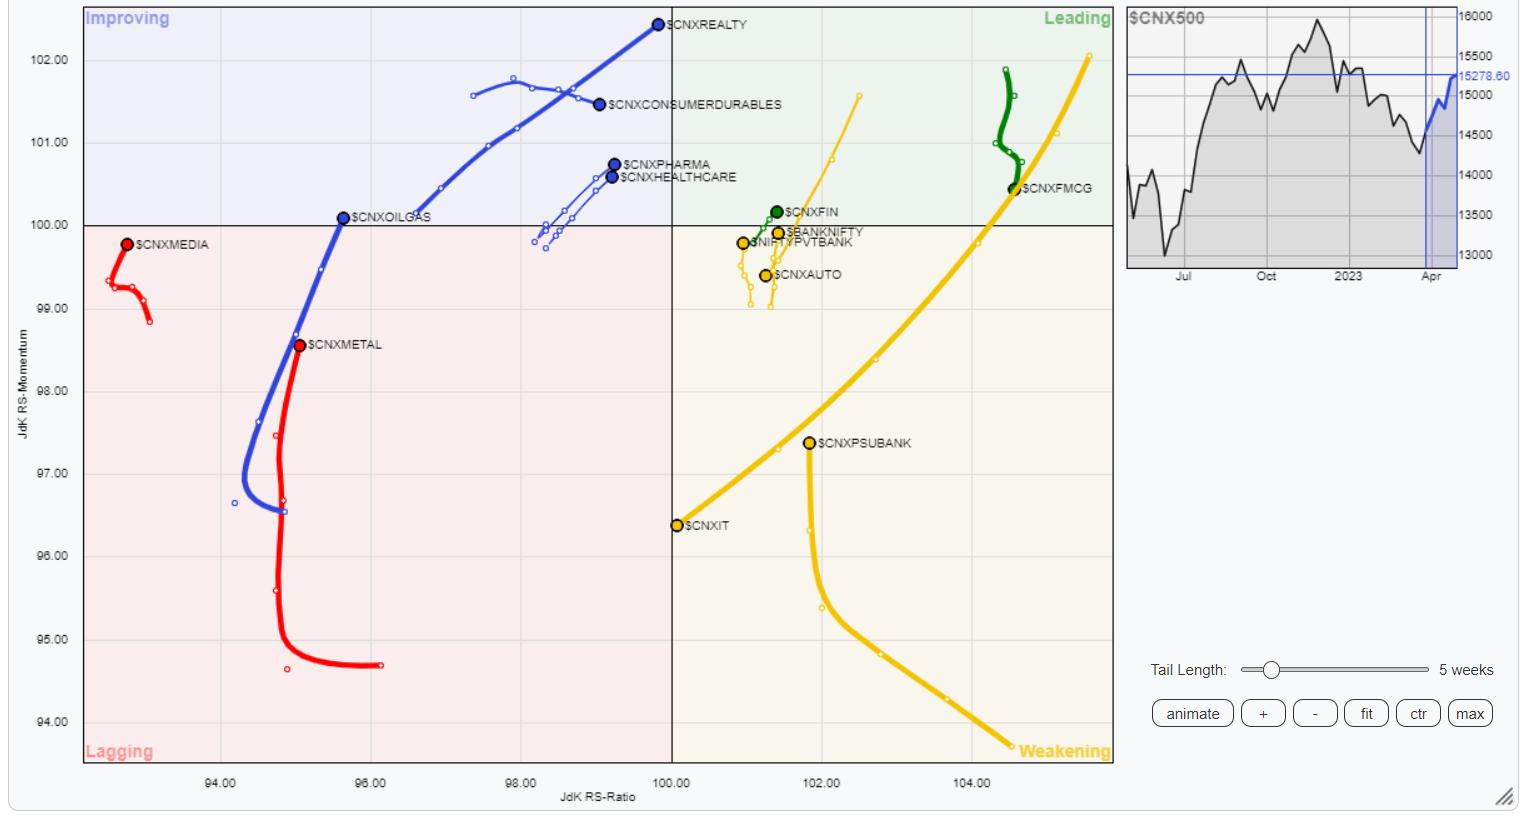
The analysis of Relative Rotation Graphs (RRG) shows does not show any major changes in the sectoral setup as compared to the previous week. We have PSE, FMCG, Infrastructure, Midcap 100, Financial Services, and PSE indices inside the leading quadrant. We will see these groups relatively outperforming the broader NIFTY500 index. Among these, except for the Midcap, the rest of the sector indices are seen slightly giving up on their relative momentum.
PSU Banks index is inside the weakening quadrant, but they are seen sharply improving on its relative momentum. Nifty AUTO and IT continue to rotate inside the weakening quadrant.
The NIFTY Service Sector index is languishing inside the lagging quadrant. Besides this, the Metal and Media Indices are also inside the lagging quadrant but they are seen improving on their relative momentum and gaining relative strength.
The NIFTY Pharma, Consumption, and Energy Sector Indices are firmly placed inside the improving quadrant. The Realty Index is also inside the improving quadrant and is seen on the verge of rotating inside the leading quadrant. We can collectively expect resilient performance from these groups over the coming days.
Important Note: RRG™ charts show the relative strength and momentum of a group of stocks. In the above Chart, they show relative performance against NIFTY500 Index (Broader Markets) and should not be used directly as buy or sell signals.
Milan Vaishnav, CMT, MSTA
Consulting Technical Analyst

Milan Vaishnav, CMT, MSTA is a capital market professional with experience spanning close to two decades. His area of expertise includes consulting in Portfolio/Funds Management and Advisory Services. Milan is the founder of ChartWizard FZE (UAE) and Gemstone Equity Research & Advisory Services. As a Consulting Technical Research Analyst and with his experience in the Indian Capital Markets of over 15 years, he has been delivering premium India-focused Independent Technical Research to the Clients. He presently contributes on a daily basis to ET Markets and The Economic Times of India. He also authors one of the India’s most accurate “Daily / Weekly Market Outlook” — A Daily / Weekly Newsletter, currently in its 18th year of publication.


