
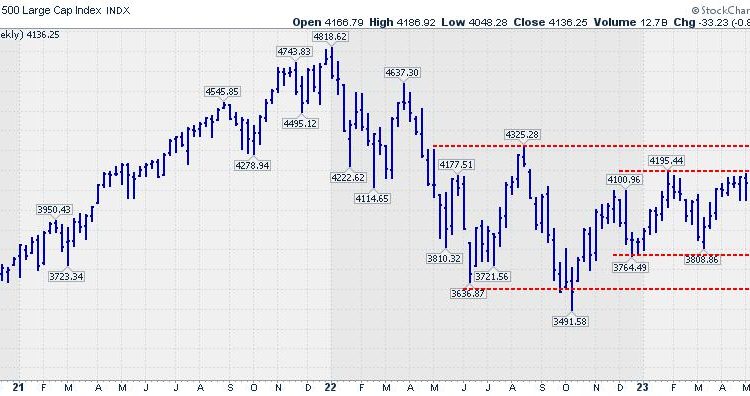
While the S&P 500 struggles to push beyond its overhead resistance in the area around 4200, money is rotating out of offensive sectors into defensive AND sensitive.

On the weekly chart, two trading ranges are starting to emerge. The first one is the more narrow one, between roughly 3800-4200. The second one is a little broader and shows up between 3600 and 4300.
In the near term, a break above 4200 will very likely find resistance only 100 points higher, while a break below 3800 will find renewed support near 3600.

Zooming in on the daily chart for $SPX, you can seen that, in the last two weeks, a new support level has emerged at 4050. The actionable takeaways from these observations are twofold. In case 4200 gives way, a rally may be expected towards the next overhead barrier near 4300, while downside risk will be limited by the old resistance, now support, near 4200. On the flip side, when the recent lows at 4050 are broken downward, a further decline toward the lower boundary of the range near 3800 seems to be in the cards.
Given the strong seasonality for the S&P 500 in May as discussed in Sector Spotlight last Tuesday, in combination with the market holding up well despite some news grenades being dropped here and there, I am leaning towards an upward break.
Under the hood, an interesting sector rotation is underway.
Offensive Sectors


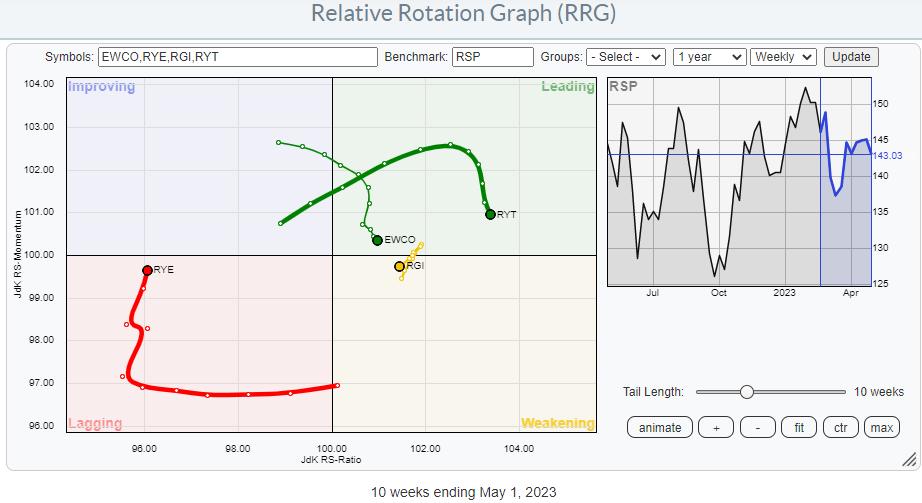
The RRGs above show the rotation for cap-weighted offensive sectors versus the rotation of their equal-weight counterparts. The negative rotation is clearly visible in both charts, justifying the conclusion that investors are moving away from the more cyclical stocks at the moment.
Defensive Sectors


These two RRGs show the rotation for the defensive sectors, and although the rotational patterns are all positive, hence in favor of defensive sectors. It is clearly visible that the equal-weight sectors are ahead of the cap-weighted sectors. This suggests that the cap-weighted defensive sectors have recently been held back by the larger-weight stocks in them, while the equal-weight sectors were already showing a rotation that took them through improving and well into the leading quadrant.
Such a rotation usually signals a more risk-off scenario, which would be in line with the observation of money flowing out of offensive sectors (into defensive) but does not really align with the S&P pushing against resistance and looking to break higher.
This is where the third group of sectors comes in.
Sensitive Sectors

This group of sensitive sectors, which consists of Information Technology, Communication Services, Industrials, and Energy, seems to be the decisive factor at the moment.
The two RRGs above show the strength of Information Technology and Communication Services. Both the cap-weighted and equal-weighted versions are inside the leading quadrant. With Technology being the largest sector in the universe, this creates a big positive pull for the S&P 500 itself.
In the cap-weighted index, Industrials and Communication Services are pretty much similar with 8%, which offsets this rotation on the cap-weighted RRG. On the equal-weight RRG, the difference in position between RGI and XLI suggests that larger stocks are dragging down XLI while the industrials sector, in general, remains on the right-hand side of the RRG.
Conclusion
All in all, the current sector rotation shows a move from offense to defense, which warrants some caution with regard to the S&P 500. However, the current strength of, especially Technology, Communication Services, and to a lesser degree, Industrials, tips the scale to the positive side and makes me look for an upward break and an initial move toward 4300.
#StayAlert and have a great weekend, –Julius
Julius de Kempenaer
Senior Technical Analyst, StockCharts.com
Creator, Relative Rotation Graphs
Founder, RRG Research
Host of: Sector Spotlight
Please find my handles for social media channels under the Bio below.
Feedback, comments or questions are welcome at Juliusdk@stockcharts.com. I cannot promise to respond to each and every message, but I will certainly read them and, where reasonably possible, use the feedback and comments or answer questions.
To discuss RRG with me on S.C.A.N., tag me using the handle Julius_RRG.
RRG, Relative Rotation Graphs, JdK RS-Ratio, and JdK RS-Momentum are registered trademarks of RRG Research.

Julius de Kempenaer is the creator of Relative Rotation Graphs™. This unique method to visualize relative strength within a universe of securities was first launched on Bloomberg professional services terminals in January of 2011 and was released on StockCharts.com in July of 2014.
After graduating from the Dutch Royal Military Academy, Julius served in the Dutch Air Force in multiple officer ranks. He retired from the military as a captain in 1990 to enter the financial industry as a portfolio manager for Equity & Law (now part of AXA Investment Managers).
Learn More


