
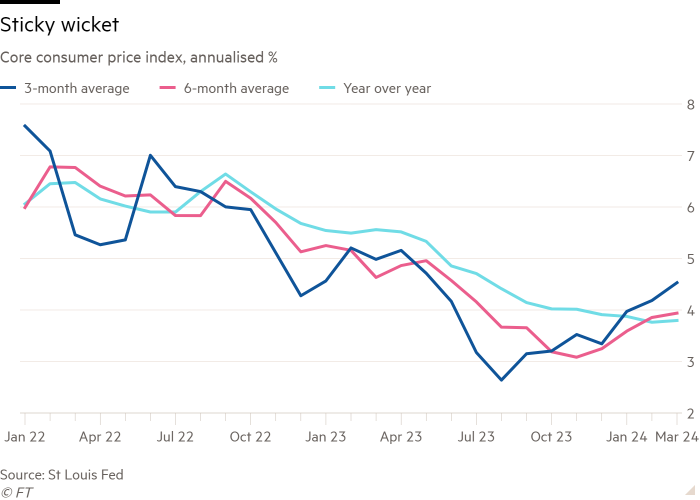
Good morning. Inflation is confusing. After Wednesday’s moderately alarming consumer price inflation report, we showed you this chart of core CPI inflation stuck in the high threes, at best:
Thursday brought new data on producer prices, letting analysts update forecasts for personal consumption expenditure inflation, which the Fed targets. PCE looks cooler than CPI:
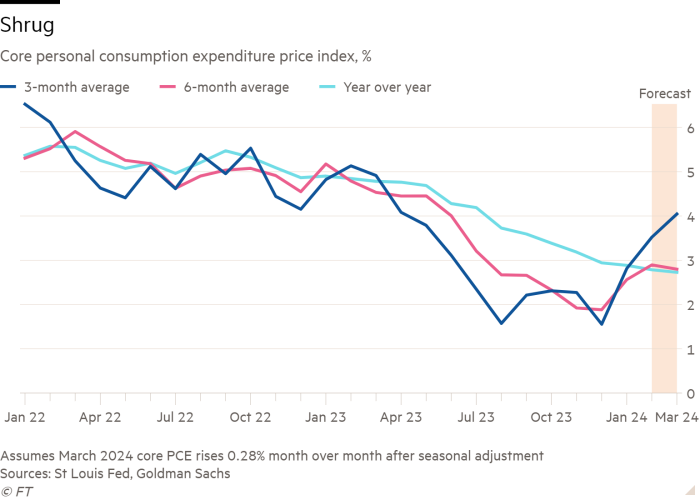
Depending on which cut you fancy, core inflation is either slowly grinding down to 2 per cent, stuck in the high threes or surging past 4 per cent. Clear as mud. Email us: robert.armstrong@ft.com and ethan.wu@ft.com.
Friday interview: Harley Bassman
Almost all of what fixed-income options traders do on Wall Street today, Harley Bassman did first. At Drexel Burnham, Merrill Lynch, Credit Suisse, Pimco and now Simplify Asset Management, the “convexity maven” created the Move index of bond market volatility and broke ground in many other areas of mortgage and structured products trading.
He spoke with Unhedged this week about how he got his start, why buying recently issued mortgage-backed securities is the best trade right now and why what he does is much simpler than it looks.
Unhedged: How would you describe your intellectual contribution to what Wall Street does?
Harley Bassman: I am from California, and went to UChicago Business School, which is the quant school, in contrast to the Harvard-style case study method. I landed on Wall Street in 1983, at 23 years old. Just a year or two prior, the Chicago Board of Trade started trading financial futures, and then options on financial futures. I had one options class, one programming class — but that’s all you need! It’s the one-eyed man in the land of the blind. I knew what options were and I could code them into a computer, on a five-inch floppy disk.
I landed at Drexel Burnham and was working with the money market group. They wanted to start up this option business at Drexel. And so they got me and a grizzled old man of 36 years old (when you’re 23, that looks old.) My old options class notes mentioned you could take an options pricing model for stocks, based on a quarterly dividend payment, and adapt it for bonds, by modelling a dividend that accrues every day.
So one weekend I came in, sat at one of our three IBM computers and coded up an option pricing model for bonds. I walk in on Monday morning saying, “Boss, I got this.”
Unhedged: Once you have that computer that can model options for bonds, what does that then allow you to do?
Bassman: I can price options! Before I did this, I remember Sir James Goldsmith, one of these corporate raiders in the 1980s, wanted to buy call options on $100mn worth of bonds. We just made up the price. We had no idea what it was supposed to be.
Unhedged: But now you have an IBM computer that can tell you an accurate price, at a spread that works for you. You’re standing in the middle and know more than other people about what the options should cost.
Bassman: People get hung up on this. Option models don’t give you the “right” price. All they say is this: if I have a three-month call with the strike price at $100, the put option price is this. It’s called put-call parity. You can then say, well, a three-month option should cost this, a four-month option should cost that. It’s more complicated, but at least it gives you a ballpark idea.
In 1985 I joined Merrill Lynch and built all their models to price options on mortgage securities. Then from there, I started doing mortgages and mortgage derivatives. Basically, I dealt in everything that had convexity.
Three things matter in bonds. You can be in cash — ie, riskless overnight money. Anything that’s not cash means you’re taking duration risk; when do you get your money back? That’s number one. Number two is credit risk; can you get your money back? Third, convexity risk; how you get the money back, the path dependency of it.
What is convexity? Convexity is non-linear return. What does that mean? If you flip a fair coin, you win one, lose one. Positive convexity would be win two, lose one. Negative convexity would be win two, lose three. So say you buy the 10-year Treasury, and then rates go up or down by 100bp. You’d either lose or make 8 points — no convexity.
But if I showed you a bond that was win two, lose one, that’s a better bond! Markets adjust to that bond’s positive convexity, though, so you’d get paid less yield. But how much less yield? That’s why we hired all these physics PhDs back in the 1990s. What they did is figure out how much yield you should get on a convex bond. What do you call that calculation? OAS: option-adjusted spread, figuring out what the fair price is by backing out a bond’s embedded optionality.
Unhedged: Let’s talk about it in terms of a mortgage, which is probably the way people are most familiar with convexity. Last year you launched a mortgage securities-backed ETF, MTBA, that is supposed to have favourable convexity characteristics. Tell us about that.
Bassman: MTBA buys mortgage bonds priced at 98 or 99 [cents on the dollar]. They have a coupon of around 6 per cent. They can fall to a price of 80, but cap out at something like 104. You can go down 20, but only up 5 — that’s negative convexity. Is that bad? Well, there are no bad bonds, just bad prices. At some price, I’m willing to take that “lose 20, make 5” trade.
Right now, the current pricing structure is off-the-charts crazy. For example, you’re getting paid 150bp over Treasuries for the Fannie Mae sixes [Fannie Mae bonds with a 6 per cent coupon], and the average over history is like 75bp. Look at the chart!
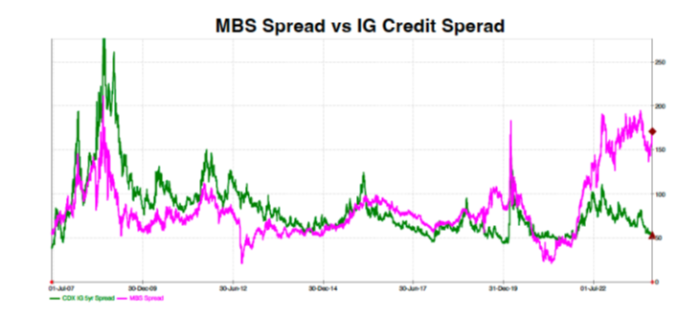
This is mortgage spreads, in pink, and investment-grade credit spreads, in green. They’ve blown apart.
Unhedged: Why?
Bassman: As a conceptual example, say the bond market is at $100. If you buy a Fannie Mae 6 [per cent coupon], it’s as if you’re selling a 105 call for 6 points [the “call” is mortgage holders’ option to refinance if rates should fall]. So net-net, you own that buy-write package for $94. If you own a Fannie 3 [per cent coupon], that’s like having a bond at 80, and selling a 105 call for half a point. That’s the difference. With the Fanny six, I have 6 points from the call I have sold, so if the whole package goes down because of higher rates, the package goes down by less. The bond goes down by two points, but the call, which I’m short, goes down by one point, so the total package goes down by only one.
Unhedged: Why am I getting this much spread on the MBS? The market is supposed to be efficient.
Bassman: The Treasury component is the Treasury component. The interest rate risk on US Treasuries is similar for both the Fannie Mae 3 and the Fannie Mae 6. What must be the difference? The call component — it’s highly priced. Six points! Historically it trades at 3 or 4 points.
Unhedged: So there must be lots of demand to buy this call. Why is the market for calls so hot?
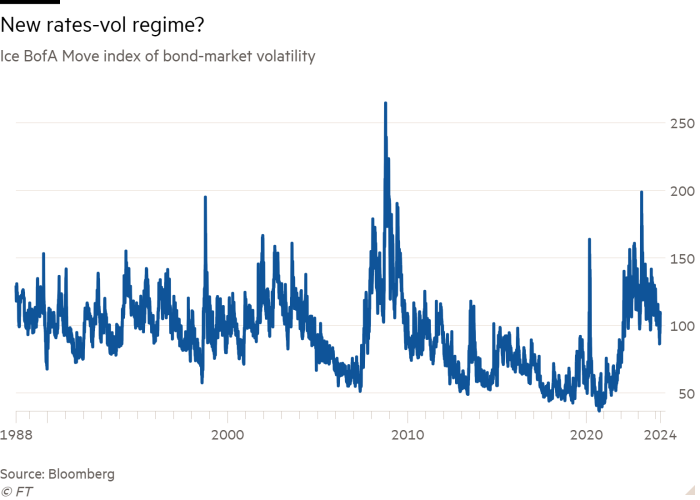
Bassman: Two reasons. One: implied volatility is very high, and as implied volatility rises option prices increase. The Move index isn’t like 140 anymore, but 110 is still a big number [see chart below]. It was reading at 55 a few years ago — it’s basically doubled. And the mortgage pre-payment options can be modelled as a three-year expiry option on the 10-year. It’s not a one-month expiry option like the Vix [index of stock market volatility]. It’s a big old meaty option!
That’s reason number one. Reason number two: inverted yield curve. An inverted curve puts the forward rate — for mortgage bonds, use the implied 10-year rate three years from now — below the spot rate. That’s just bond maths. So with the curve inverted like it is now, the option price for a 4 per cent strike call [a call whose strike price is 4 per cent above the current price] is, say, 6 points. But if the curve steepens, the forward rate goes up, and the forward price goes down. If the price was 102, and the option was at 100, then the option was in the money. If the curve steepens and the price goes to 97, the option is out of the money and worth less. And the mortgage bondholder is short that option.
That’s what is happening here: this massive meaty option, when the curve steepens, is going to go down by a lot.
Unhedged: That’s clear. But it still has the feel of free money. We’re all looking at the inverted curve. We’re saying, curves don’t invert forever. The Fed is going to cut eventually. Why is the options market passing me this extraordinary opportunity, based on an inverted curve that everybody seems to know is going to steepen sooner or later?
Bassman: Think about your grandma. She’s in T-bills at 5.25 per cent right now. Pretty good deal. Or she could buy 10-year bonds at 4.55 per cent. If she goes with the 10-year, she’s giving up 70 basis points, but it doesn’t cost her anything — she is funded with cash.
A hedge fund, on the other hand, doesn’t have any cash in hand. It is 100 per cent borrowed money. If you’re a Wall Street dealer, you have no money. The firm gives you the ability to buy and sell, but the firm charges you at the overnight spot rate. I buy the 10-year at 4.5 per cent and spot is 5.2 per cent; every day I’m writing a cheque.
For grandma, it’s an opportunity cost. For the hedge fund, it’s a cash cost. You’re underperforming. How long can you underperform before you get fired? The reason yield curves don’t last for ever is people lose money and get fired.
Unhedged: How does this affect the option price?
Bassman: You have arbitrage entities out there, like AGNC or Annaly [two mortgage Reits that buy mortgage-backed securities]. They are levered seven to one. They can’t have a 35-year duration. So they hedge it by buying options. And because of the shape of the curve, that hedge creates massive negative carry. Therefore, they are only going to buy mortgage bonds if they have a positive spread to compensate for that. So the mortgage bonds have to go up in yield to make it all work.
Yeah, we know the Fed is going to cut, but we don’t know when. If you buy a three-month call option, and the market rallies on month four, you’re a schmuck. So you buy a six-month option, but you have to pay more money for that. So what has happened is that mortgage prices reflect the inverted yield curve. The market is forcing mortgage bonds down in price and up in yield, because the embedded option has gone from 3 points to 6 points because of the inverted curve and the high vol.
Now think about this. What can you buy on the Treasury curve that yields more than 5.35 per cent? Nothing! The overnight rate is the highest spot on the curve. Can you buy investment-grade corporate bonds for more than 5.35 per cent? Nope! They are about 5.05 per cent.
Unhedged: So with the Fannie Mae sixes, you are getting a product without credit risk, a better yield than the highest point on the curve, which is the overnight, and you are getting some duration.
Bassman: Almost as much duration as the five-year. And what else do you get? It’s the best part: a massive yield curve steepener trade. You are 55-60bp over the three-month rate, and you get a massive two-point win if the curve steepens.
Unhedged: OK, so I’ve just purchased your product. What is the best-case and worst-case scenario for me?
Bassman: Best-case scenario: you’re short vol and the market doesn’t move. The worst case is that rates move a lot in the short term since you are short convexity. Again, convexity is “path dependent”, it matters how you arrive at the final location. If rates move gradually over a year, you’re OK, because you make so much money on the call option. If rates move quickly, the change in the bonds duration hurts you.
If you’re worried about a big rates move tomorrow, what [Wednesday’s consumer price index] number means is that we’re going nowhere. The Fed isn’t going to hike. So [with mortgage bonds, in effect] you get to buy a Treasury security, and sell a 6-point call against it at a very high vol and inverted curve.
I feel much more comfortable owning MBS after the recent inflation data. The Fed isn’t going to hike. So you get to buy a Treasury security, and sell a 6-point call against it at a very high vol and inverted curve with reduced risk of a large market move.
Unhedged: On the other hand, we can imagine a nightmarish scenario where inflation starts getting out of control, where it’s not stuck at 3 per cent but rather accelerating past 4 per cent. Then you might get rate rises.
Bassman: And I’m getting paid for that. I’m getting 150bp over Treasuries with no credit risk. Yes, there’s no free lunch; I can’t guarantee you’re going to win. But if you look at all the stuff out there, I think taking convexity risk is a better risk-return trade right now than taking credit or duration risk. As I said, no bad bonds, just bad prices.
[Meanwhile, the rest of the bond universe] isn’t going to go anywhere. The idea that the Fed will cut six times or three times this year is done. Bonds are where they are. At this point, you should just buy three-month paper as far as I’m concerned.
Unhedged: Earlier you mentioned Annaly, a mortgage Reit that got murdered in the big rates move. From $38 in 2021, it’s now an $18 stock with a 13 per cent dividend yield. Why did it do so poorly?
Bassman: Two things happened. One, they’re short convexity and the Fed hiked rates 500bp in nearly a year. Two, they’re long the yield curve. If you’re long mortgage securities, you want a steep curve. It was the massive curve inversion that blew out Annaly, AGNC and other levered mortgage Reits. Annaly and AGNC are just MTBA levered 7x. They’re going to win big when the Fed starts cutting.
Unhedged: You’re the inventor of the Move index. I look at that Move chart and it looks like it’s at a higher plateau now, as you referred to earlier. And there’s a lot of talk that we’re in a new regime. The balance of investment and savings has changed, government deficits are higher, the era of low rates is over, and so on. If we are in a new rates regime, are we also in a new rate volatility regime?
Bassman: Yes. The old rule of [the Move index] chart was that it ranged from 80 to 120, from 1985 to 2000. You’re supposed to sell 120 and buy 80. No one ever did that because when we got to 80, the market was not moving that much and you didn’t want to buy vol because the market wasn’t moving. And at 120, everyone was under their desk crying for their mother. Sell at 120, are you crazy? I don’t have any sellers!
So then we have the post-GFC regime where the Fed put its thumb on the scale and crushed volatility. They crushed it in a lot of ways: forward guidance, dot plots, buying mortgage bonds. The Move index started to range from 60 to 100. The new range now is probably 75 to 110. We’re not seeing 50 or 60, but I don’t think we’ll see 120 either.
Remember that the Move index is a real number. Take the Move, divide it by 15.9 — that’s volatility in basis points per day per month. (Why 15.9? Square root of 252, the number of trading days in a year.) That means with the Move index at 100, the market thinks we’ll move 6bp close-to-close every day for 21 trading days. That’s across the whole curve.
I will say this: If you can pass a ninth-grade statistics class, you can do my job. It’s not much harder than that. We just talk a little faster and use some Greek letters. But everything we do is covered in ninth-grade stats.
One good read
British politicians learn to beg on email like Americans.
FT Unhedged podcast

Can’t get enough of Unhedged? Listen to our new podcast, hosted by Ethan Wu and Katie Martin, for a 15-minute dive into the latest markets news and financial headlines, twice a week. Catch up on past editions of the newsletter here.